


Power Usage Effectiveness (PUE) Trends in Data Centers: Insights and Challenges
Power Usage Effectiveness (PUE) is a widely adopted metric that evaluates the energy efficiency of a data center. Introduced by The Green Grid, it is defined as the ratio of the total facility energy to the energy consumed by IT equipment:
IT Equipment Energy
Key Insights from the Graph
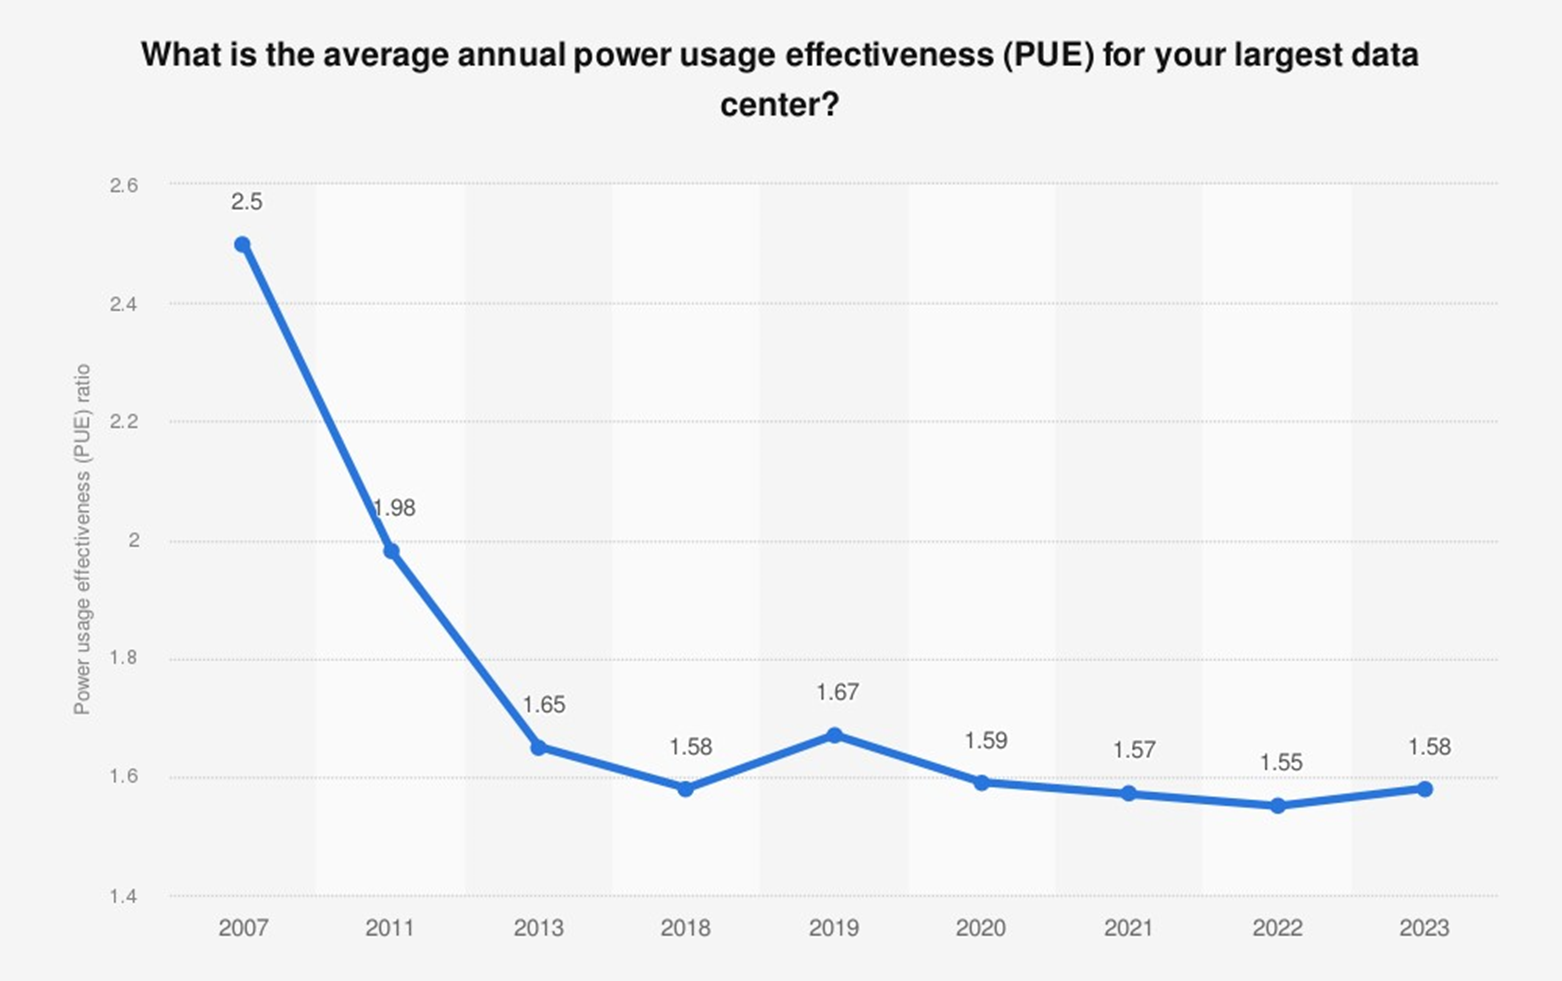
The provided graph demonstrates the evolution of average annual PUE that survey respondents report for their largest data center, from 2007 to 2023. Here are the key observations:
Decline in Worldwide PUE Over Time:
- Between 2007 and 2013, PUE saw a sharp decline from 2.5 to 1.65, reflecting a significant improvement in energy efficiency.
- This period coincided with technological advancements in cooling systems, server optimization, and widespread adoption of best practices in data center design.
Plateauing of PUE:
- From 2018 to 2023, the average stayed between 1.55 and 1.67, and between 1.55 and 1.59 from 2020, indicating that while efficiency gains continued, the rate of improvement slowed. Many large operators likely reached a point where diminishing returns from additional efficiency investments became evident.
A Stalled Average:
- The data shows a slight increase in 2023 to 1.58, the same value as in 2018. Uptime Institute’s later surveys report 1.56 for 2024 and 1.54 for 2025 (from 2025 the survey asks about respondents’ data centers rather than their largest), “the sixth consecutive year that this headline figure has virtually stood still”. This raises an important question: Why has the global average stalled despite advancements in technology?
Why Has the Global Average PUE Stalled?
- The global data center industry has rapidly expanded into regions such as Africa, the Middle East, and parts of Asia-Pacific (APAC) to meet increasing digital demands.
- Unlike colder regions (e.g., Europe or North America), data centers in hotter climates require significantly more energy for cooling, leading to higher PUE values. This naturally impacts global averages.
- Edge computing adds smaller, localized edge data centers, which may not implement the same level of advanced cooling or power efficiency technologies as larger, centralized facilities.
- Over a quarter (27.5%) of the respondents to Uptime Institute’s 2025 survey work in data centers 16 years or older. In older facilities, further efficiency upgrades often have a weaker business case, so many keep running at higher PUEs.
- Rising global temperatures may add to the energy needed for cooling, especially in regions already facing extreme heat.
Measuring PUE: categories and DCiE
PUE was introduced by The Green Grid and standardised internationally as ISO/IEC 30134-2 (first published in 2016, revised in 2026). Two facilities can report the same PUE and mean different things, because the figure depends on where IT energy is metered and over what period. The measurement categories recommended in 2011 by a joint industry task force (The Green Grid, ASHRAE, Uptime Institute, the US EPA, the US Department of Energy and others) make this explicit:
| Category | Where IT energy is measured | Period |
|---|---|---|
| PUE0 | UPS output | Peak electrical demand |
| PUE1 | UPS output | Annual energy |
| PUE2 | PDU output | Annual energy |
| PUE3 | IT equipment input | Annual energy |
The closer to the server the measurement point, the more distribution loss is counted as overhead, and the more accurate the PUE. ISO/IEC 30134-2 defines three categories (basic, intermediate and advanced resolution) and has no equivalent of PUE0. Utilisation matters too: a facility only partly filled with IT equipment shows a higher PUE, because the fixed overhead is spread over less IT load.
The inverse of PUE is DCiE (Data Center Infrastructure Efficiency): DCiE = 1 ÷ PUE × 100. It is the share of facility energy that reaches the IT load.
| PUE | DCiE | Efficiency level |
|---|---|---|
| 3.0 | 33% | Very inefficient |
| 2.5 | 40% | Inefficient |
| 2.0 | 50% | Average |
| 1.5 | 67% | Efficient |
| 1.2 | 83% | Very efficient |
Optimize Your Data Center Efficiency with Azura Consultancy
Unlock the full potential of your data center with Azura’s expertise in PUE. Whether you’re designing a new facility or enhancing an existing one, our tailored solutions ensure maximum energy efficiency, lower operational costs, and sustainability.
Addressing PUE Challenges in Emerging Markets
Efficient Cooling Technologies
- Deploy advanced cooling solutions such as liquid cooling, evaporative cooling, or AI-driven cooling optimization to reduce energy consumption in hot climates.
Renewable Energy (Lower Carbon, Not Lower PUE)
- Solar and wind power cut the carbon of the energy a data center uses, but they do not change its PUE: renewable supply sits outside the PUE calculation, so an all-renewable and an all-grid facility with the same equipment have the same PUE.
Modular Data Center Design
- Modular designs allow for scalable and energy-efficient deployments that can better adapt to local conditions.
Smart Energy Management
- Leverage AI and machine learning to monitor, predict, and optimize energy usage in real-time, improving efficiency across operations.
Localized Best Practices
- Collaborate with local governments and organizations to adapt global best practices to regional climatic and infrastructural realities.